
How the index is made
Every month, in four steps
The same cycle runs each month, so one month can be compared with the next.
Every edition reports the previous month. The survey is taken in the first days of a month and asks about the month just ended; the results are published on the 11th.
The survey opens
In the first days of each month a new survey opens with five questions, one per pillar, about the month that has just ended. Anyone can answer, once per device. Field agents also share the survey through referral links.
People answer on a 1 to 10 scale
Each answer runs from 1 (least stable) to 10 (most stable). An optional last step lets people describe their mood, give one word for Nigeria today, name a state, pick topics and leave a short comment. We don’t ask for names, phone numbers or addresses.
Editors review
When the survey closes, the team checks the submissions, flags any that look unreliable so they are left out, and reads the answers alongside verified sources: official data, credible reporting and independent assessments.
The report is published on the 11th
The report is named after the month it covers, so the reading published on 11 November is the October edition. It gives the overall reading and the five pillar scores, all out of 10, a state and an institution spotlight, and what people said. It is then locked and does not change.
The five pillars
Each pillar has one survey question. A pillar’s score is the average of everyone’s answers that month, on the same 1 to 10 scale.

Traffic duty on a busy road. Photo: Timmylegend, CC BY-SA 4.0 Security
How safe people feel where they live and travel: crime, kidnapping, conflict and the presence of security services.
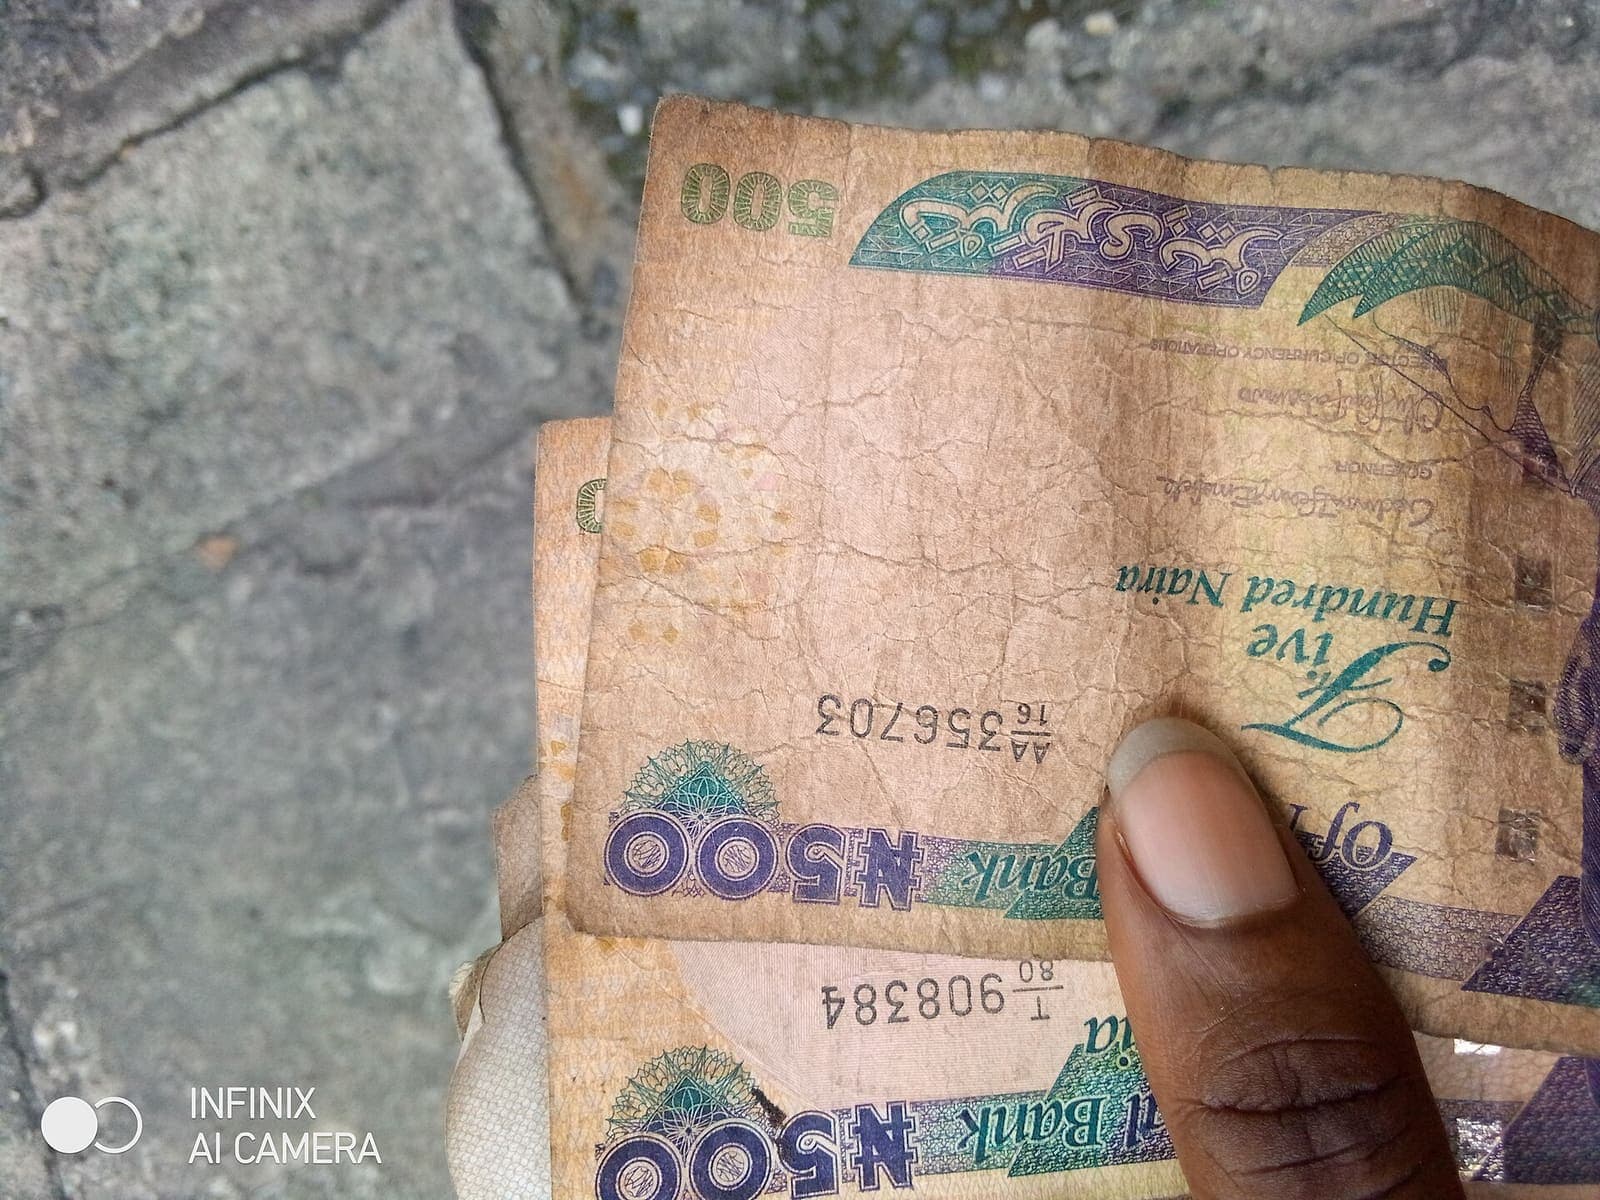
Five-hundred naira notes. Photo: Weblingdevs, CC BY-SA 4.0 FX & Economy
What prices, the naira and incomes mean for households: food and fuel costs, exchange rates and earnings.

Apapa port, Lagos. Photo: Quadrex24, CC BY-SA 4.0 Investor Confidence
Whether people expect businesses to grow, hire and invest, and how open the economy feels to investment.

National Assembly complex, Abuja. Photo: Kabusa16, CC BY-SA 4.0 Governance
How well government at every level serves people: delivery, responsiveness and trust.

Osun-Osogbo Festival, 2026. Photo: Abdulrosheed Fadipe, CC BY-SA 4.0 Social Stability
How calm and united communities feel: tensions, cohesion and everyday peace.
How the scores are calculated
Pillar scores (out of 10). The average of all valid answers to that pillar’s question in the month.
Overall reading (out of 10). Each person’s five answers are averaged, giving a personal score from 1 to 10, and the overall reading is the average of those personal scores. The editors review it alongside verified sources and explain the reading in the report.
Editions up to September 2026. These used a 1 to 5 scale for answers and pillar scores; the overall reading has always been out of 10.
Spotlights. One state and one institution each month, chosen by the editors and described using published evidence. A spotlight is not an endorsement.
Limits worth knowing
- The survey is open to anyone. It is not a random sample of all Nigerians, so read the index as a monthly signal, not a precise measure of national opinion.
- People who answer online or through field agents may differ from those who don’t.
- One answer per device per month is allowed; flagged answers are excluded.
- Small changes from one month to the next may be noise. Look at the trend across several months.

Using NSI figures
You are welcome to quote the index. Please name the month the edition covers, link to the report, and say that the overall reading is out of 10 and which scale the pillar scores use (out of 10, or out of 5 for editions up to September 2026). Each report has a ready-made citation at the end.